> ## Documentation Index
> Fetch the complete documentation index at: https://statsig-4b2ff144-kill-dead-node-pages.mintlify.site/llms.txt
> Use this file to discover all available pages before exploring further.
# Logs Explorer Overview
> Search and analyze all of your product’s logs in one place.
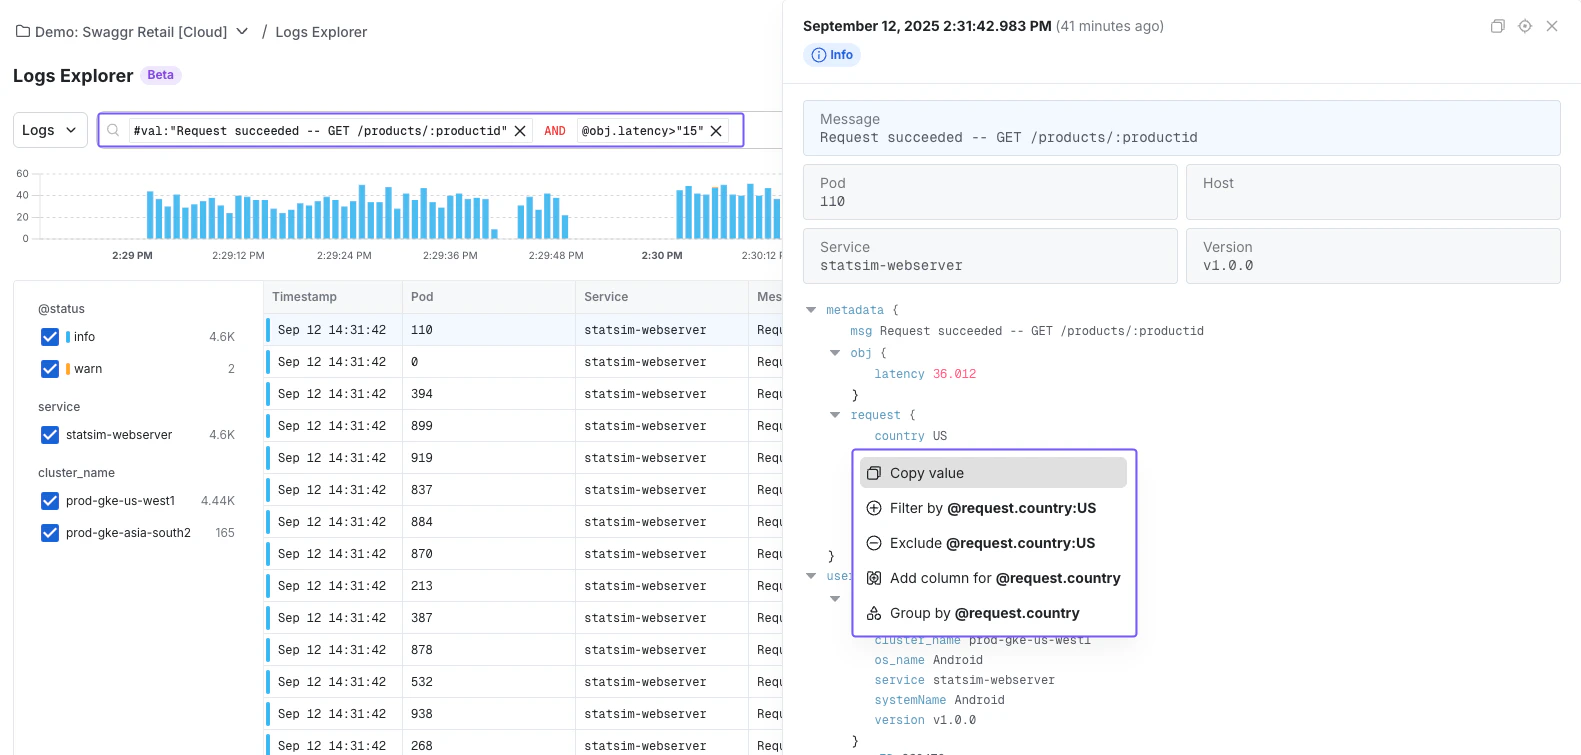
Logs Explorer lets you query logs, traces, and ingested events from a single interface. Use it the same way whether you’re debugging infrastructure issues or investigating product event streams.
* **Search**: Slice logs down to only what's relevant (by service, host, status code, etc.)
* **Group**: Aggregate logs by dimensions like region, status, or browser.
* **Visualize**: Plot log groupings over time to spot spikes, regressions, or anomalies instantly.
### Searching in Logs Explorer
* **Write custom queries**: Check out our [syntax guide](/infra-analytics/logs-explorer-queries) to craft your search
* **Using the query builder**: Point-and-click to construct filters without syntax overhead.
 ***
### Getting Started with Log Explorer
To get started with Log Explorer, follow the [OTEL onboarding guide](/infra-analytics/getting-started.mdx) to set up log ingestion. Once that's ready, you can navigate from **Infra Analytics → Log Explorer** from the Statsig left menu.
You can also use Logs Explorer in [Events Mode](/infra-analytics/events-mode-logs-explorer) to search and analyze your existing Statsig Events — no additional instrumentation needed.
***
### Getting Started with Log Explorer
To get started with Log Explorer, follow the [OTEL onboarding guide](/infra-analytics/getting-started.mdx) to set up log ingestion. Once that's ready, you can navigate from **Infra Analytics → Log Explorer** from the Statsig left menu.
You can also use Logs Explorer in [Events Mode](/infra-analytics/events-mode-logs-explorer) to search and analyze your existing Statsig Events — no additional instrumentation needed.