> ## Documentation Index
> Fetch the complete documentation index at: https://statsig-4b2ff144-kill-dead-node-pages.mintlify.site/llms.txt
> Use this file to discover all available pages before exploring further.
# Get Started with Geotests
This guide walks you through creating a Geotest experiment using Statsig. The steps include:
1. Define your Geo Types
2. Configure your Metric Source
3. Create and Configure
4. Evaluate Design Options
5. Run Analysis
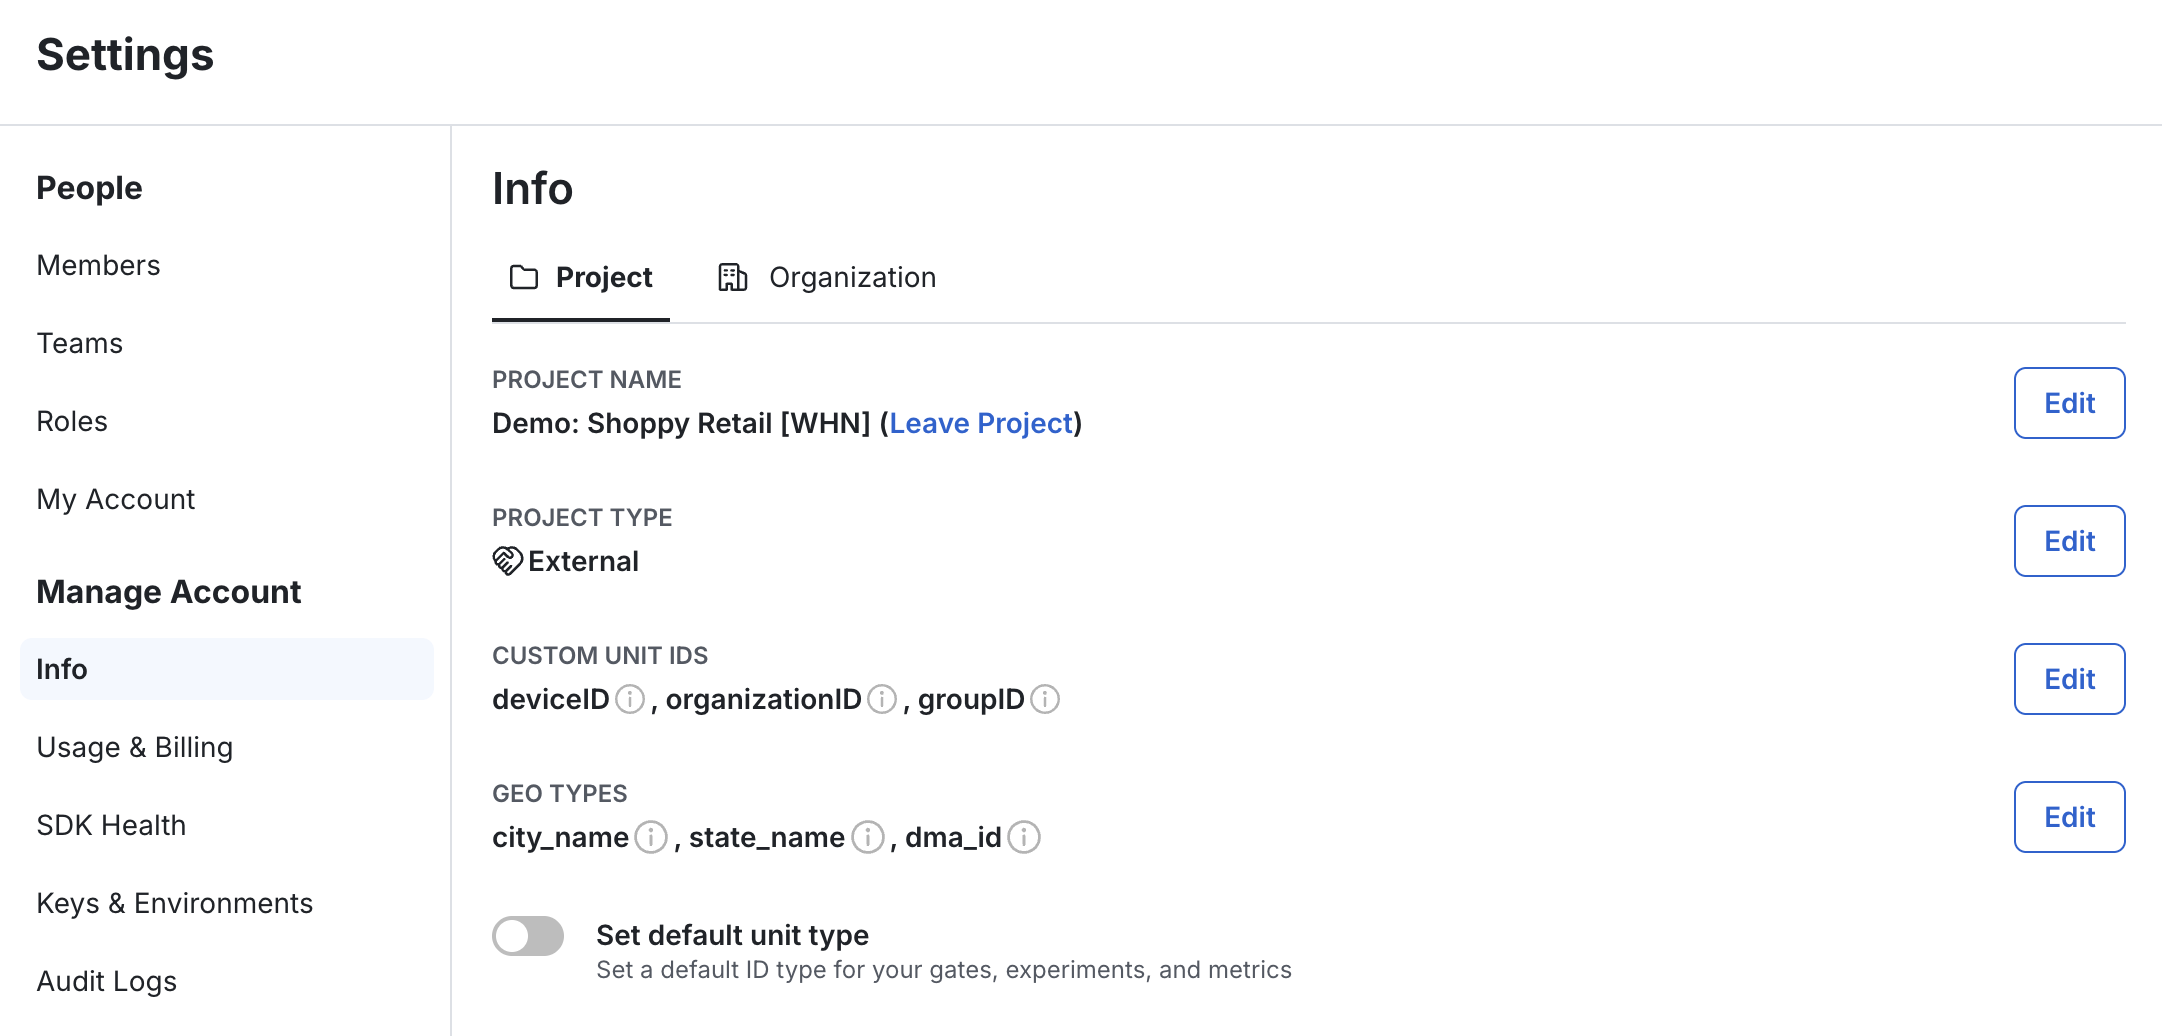
## Define your Geo Types
First decide on one more geo types relevant to your business. Some of the most common are Postal Codes and DMAs (Designated Market Areas), but Statsig allows you to define any arbitrary geo type you'd like.
 ## Configure your Metric Source
Assuming you've already added a [metric source](/statsig-warehouse-native/configuration/metric-sources/) to Statsig, you can next indicate which column(s) represent the geo type(s) you've created.
## Configure your Metric Source
Assuming you've already added a [metric source](/statsig-warehouse-native/configuration/metric-sources/) to Statsig, you can next indicate which column(s) represent the geo type(s) you've created.
 ## Create and Configure
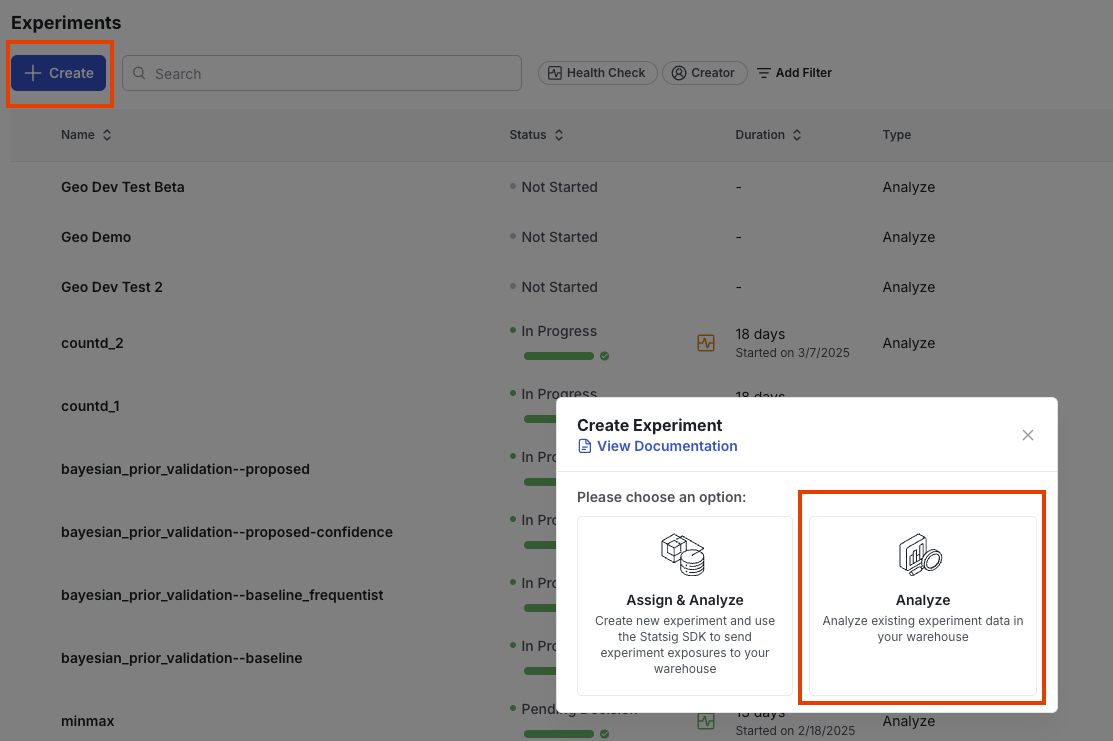
* Navigate to your Experiments page.
* Click the + Create button.
* In the modal, select Analyze to analyze existing experiment data in your warehouse.
## Create and Configure
* Navigate to your Experiments page.
* Click the + Create button.
* In the modal, select Analyze to analyze existing experiment data in your warehouse.
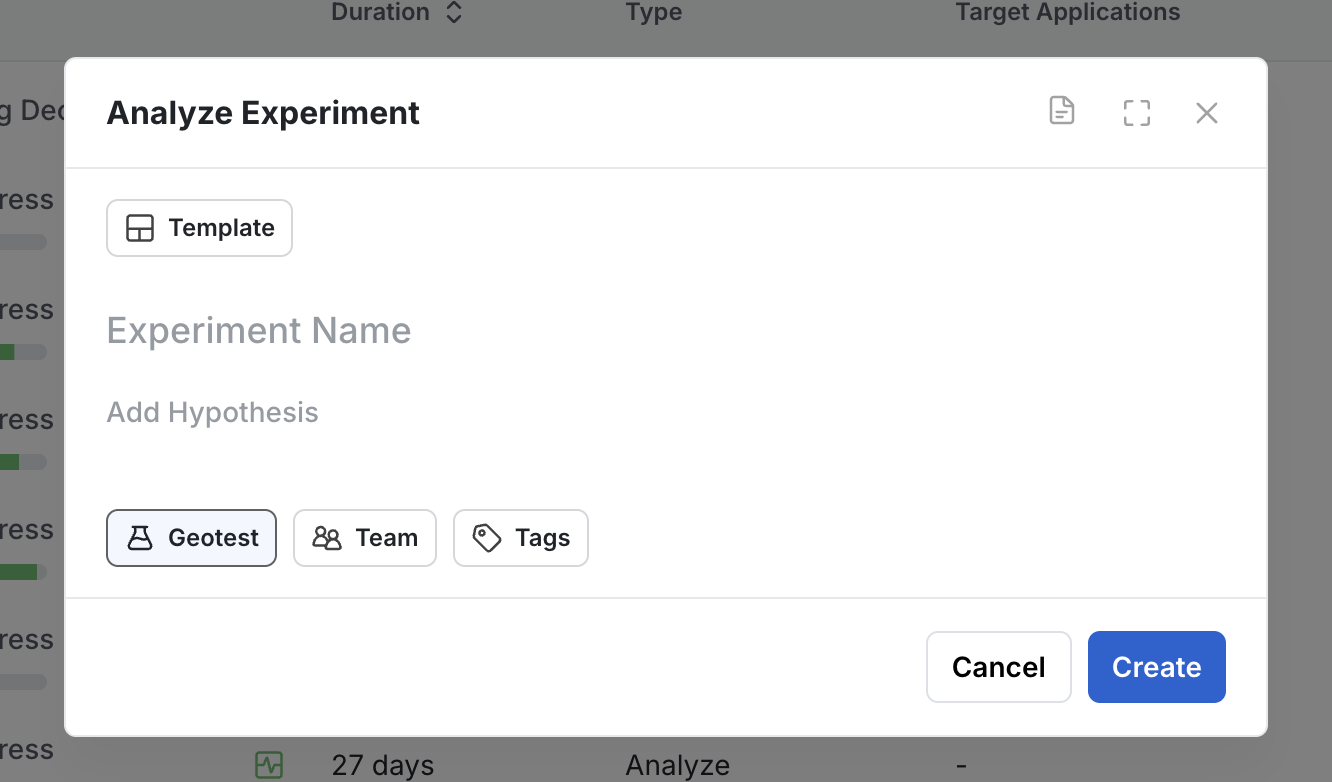
 * Enter a name and description for your experiment.
* Choose Geotest as the experiment type from the dropdown. Fill in the remaining info as you usually would
* Enter a name and description for your experiment.
* Choose Geotest as the experiment type from the dropdown. Fill in the remaining info as you usually would
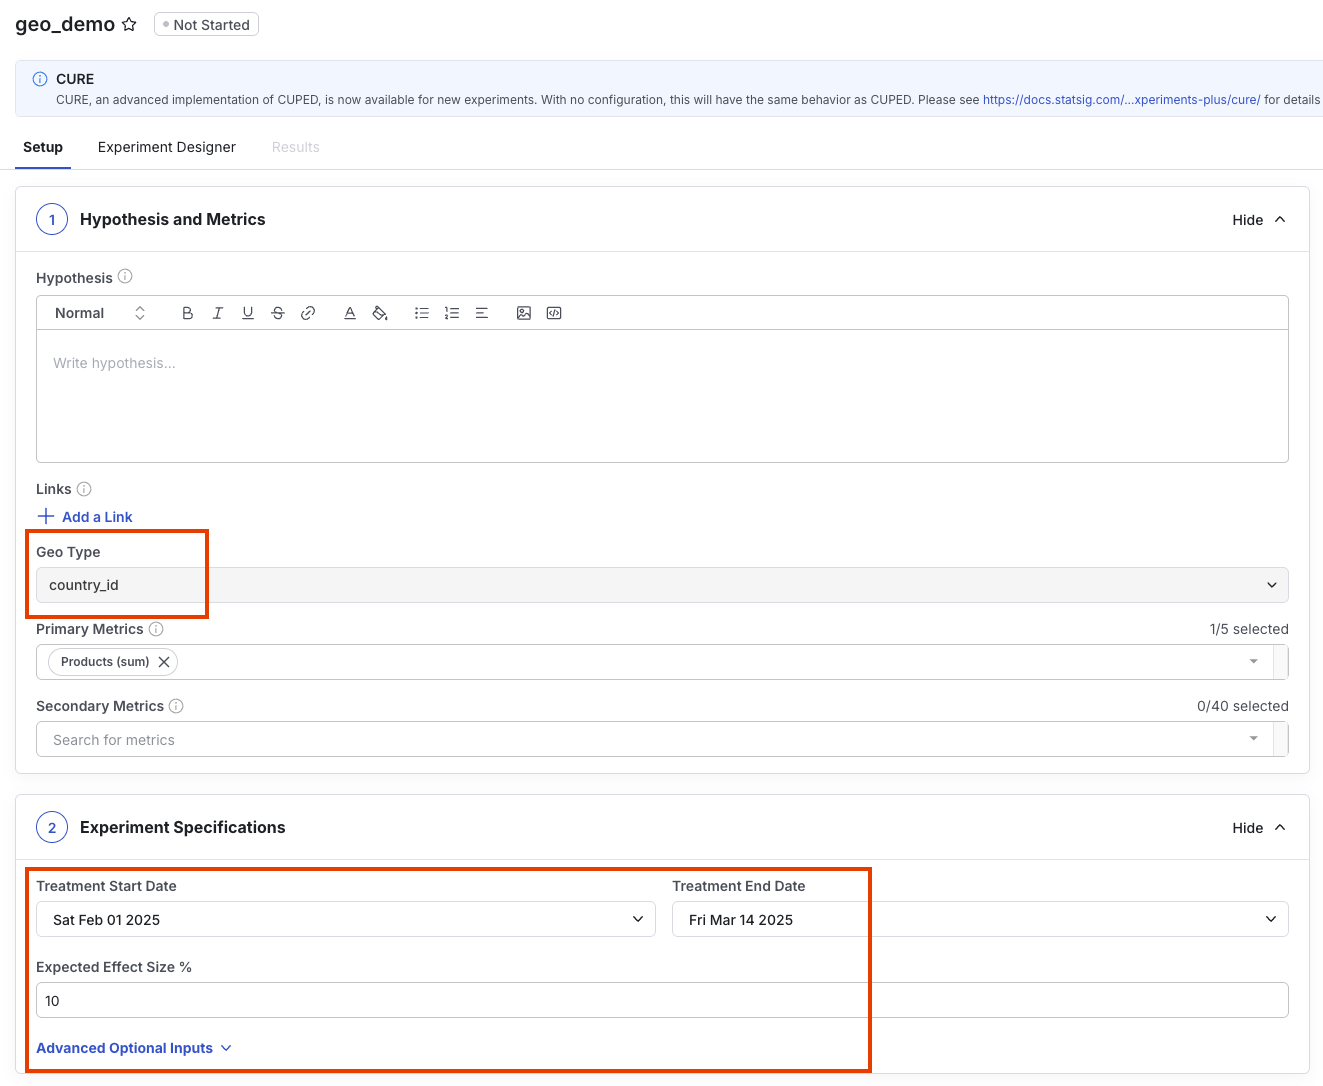
 In the Setup tab:
* Define your hypothesis.
* Set the Geo Type (e.g., country\_id) from one of the types you've defined in your project and metric sources
* Choose your Primary Metrics.
**Important Metric Types**
GeoTest metrics are currently limited to SUM, COUNT, and COUNT\_DISTINCT types. This limitation is driven by the inference techniques involved in synthetic control methodologies.
In the Setup tab:
* Define your hypothesis.
* Set the Geo Type (e.g., country\_id) from one of the types you've defined in your project and metric sources
* Choose your Primary Metrics.
**Important Metric Types**
GeoTest metrics are currently limited to SUM, COUNT, and COUNT\_DISTINCT types. This limitation is driven by the inference techniques involved in synthetic control methodologies.
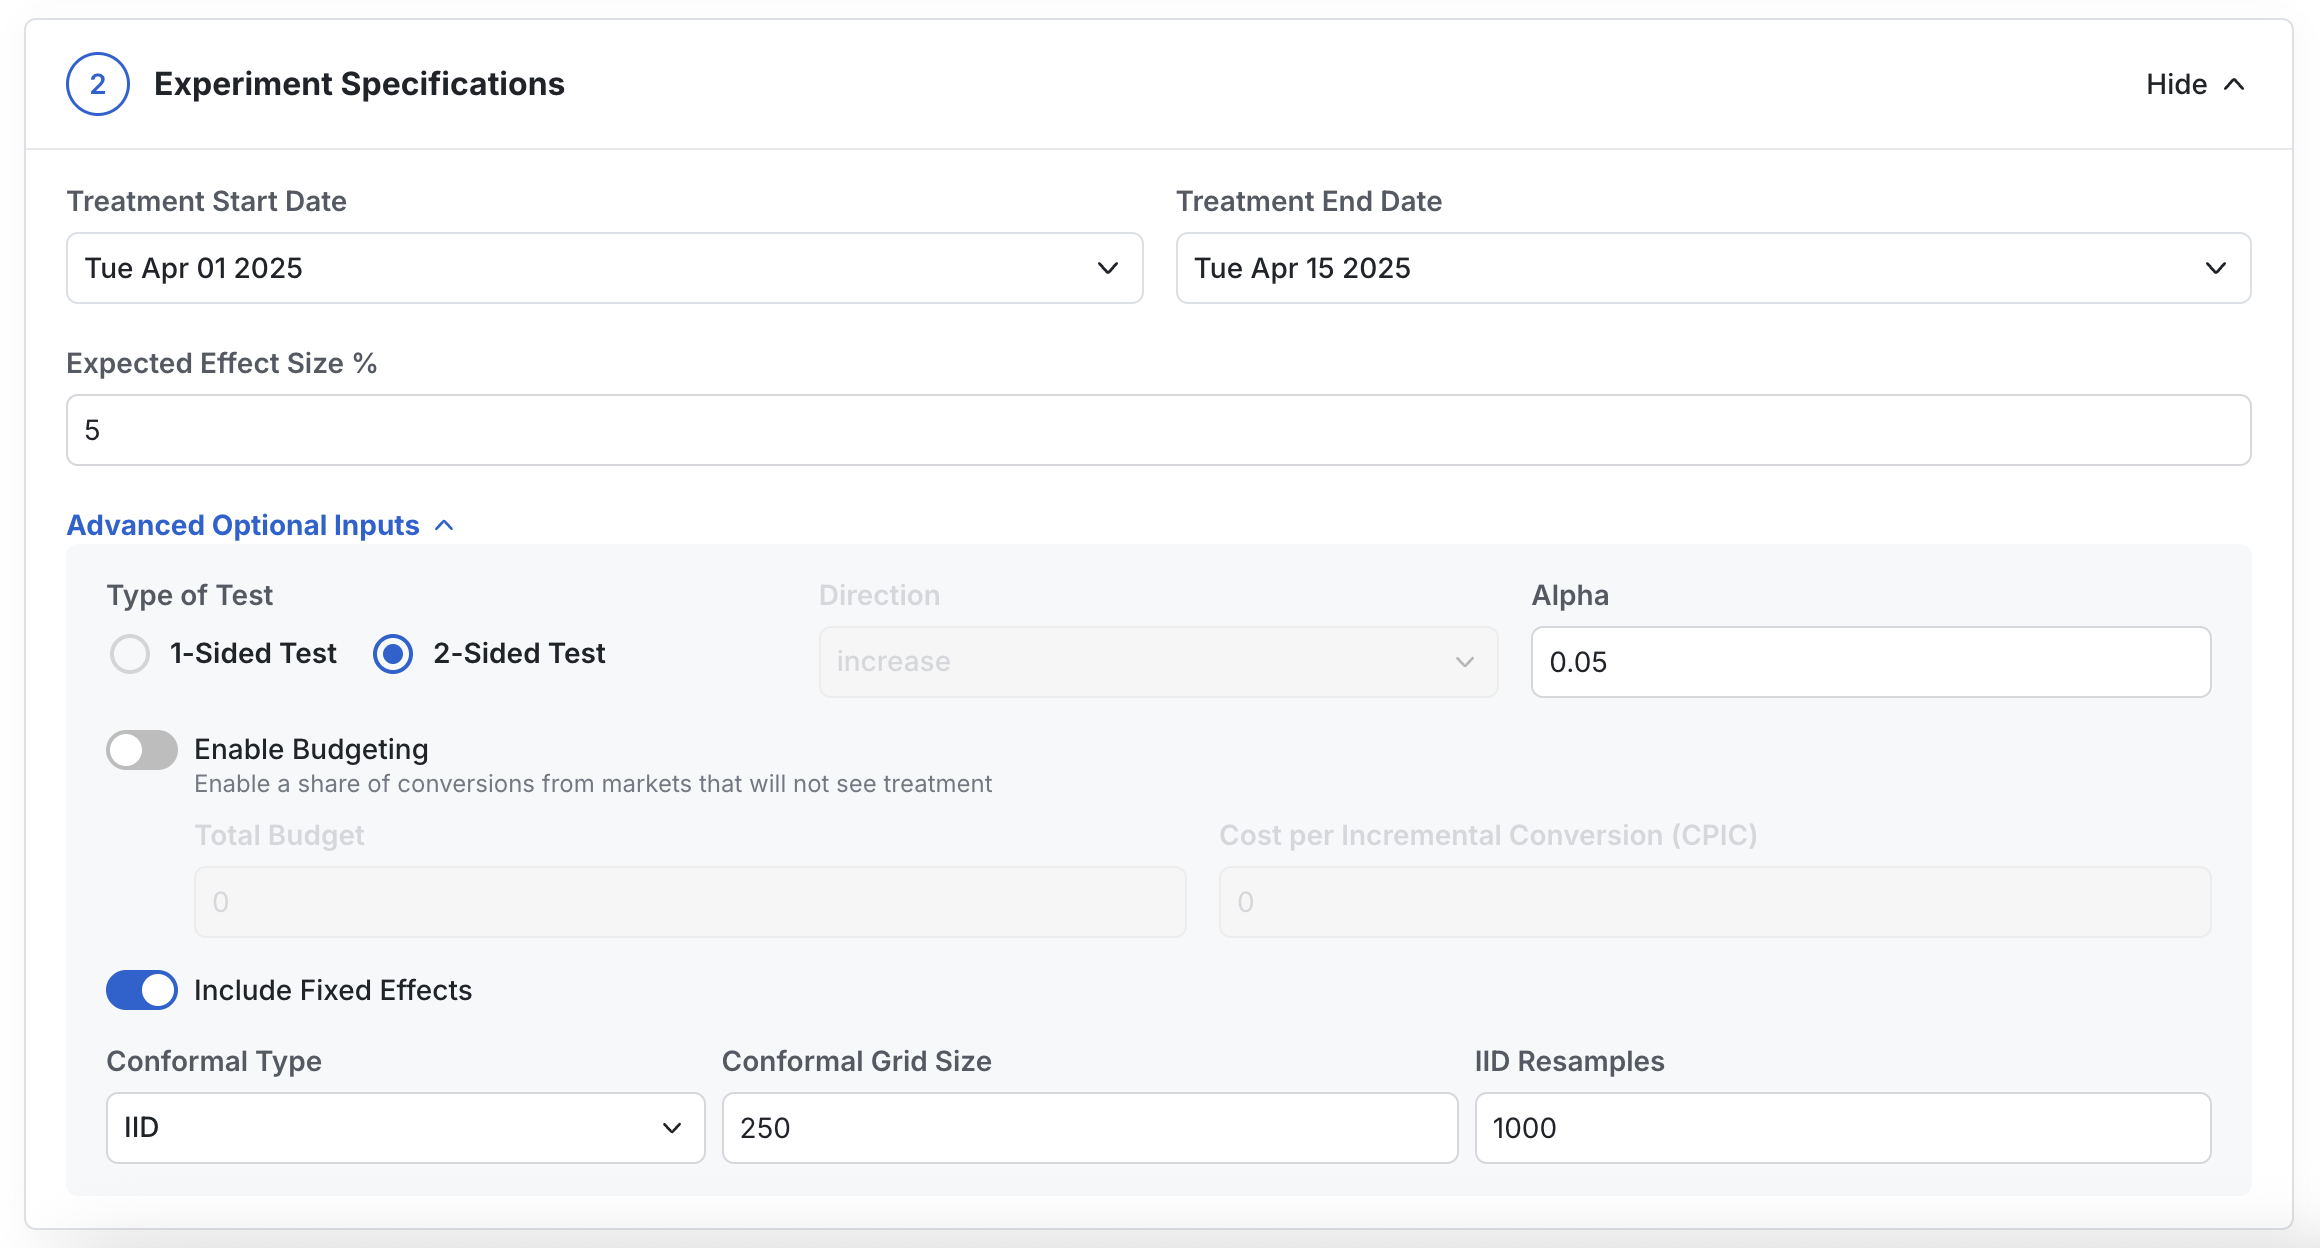
 Configure:
* Expected Treatment Start/End Dates
* Desired Effect Size % (this is the MDE you're hoping to measure; smaller MDEs will make finding a valid design harder)
* Type of Test: 1-sided or 2-sided
* Alpha level (desired type I error rate, inverse of Significance)
* Optionally enable Budgeting
* Additional advanced modeling parameters for users familiar with [Geolift's Advanced API](https://github.com/facebookincubator/GeoLift/blob/main/R/pre_test_power.R)
Configure:
* Expected Treatment Start/End Dates
* Desired Effect Size % (this is the MDE you're hoping to measure; smaller MDEs will make finding a valid design harder)
* Type of Test: 1-sided or 2-sided
* Alpha level (desired type I error rate, inverse of Significance)
* Optionally enable Budgeting
* Additional advanced modeling parameters for users familiar with [Geolift's Advanced API](https://github.com/facebookincubator/GeoLift/blob/main/R/pre_test_power.R)
 ## Generate Design Options
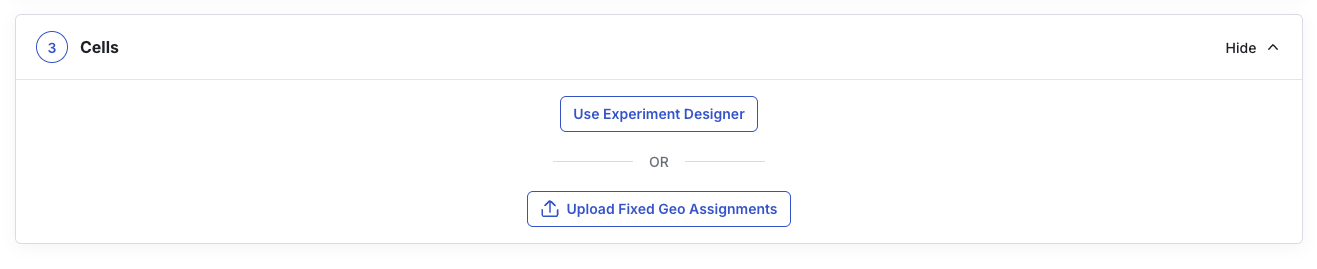
When you're happy with your initial settings, click "Use Experiment Designer" to begin to design process.
## Generate Design Options
When you're happy with your initial settings, click "Use Experiment Designer" to begin to design process.
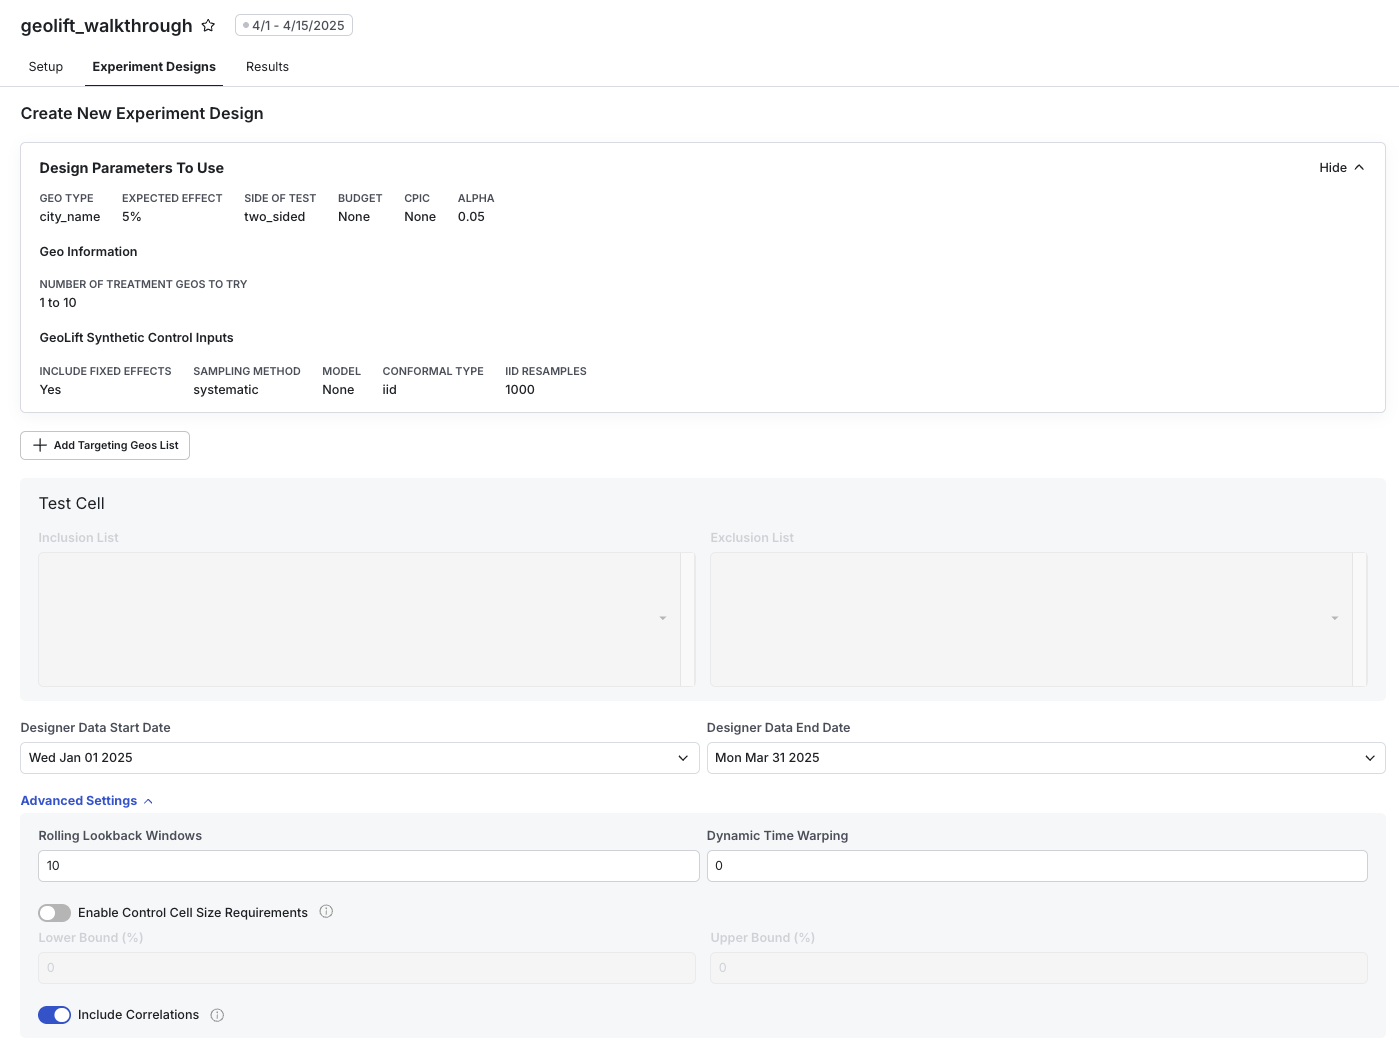
 The Experiment Designer automates the process of evaluating potential splits of geos. Creating a new design set involves 3 steps:
1. **Define your targeting**
2. **Set any Inclusion or Exclusion overrides**
3. **Define your date range**
The Experiment Designer automates the process of evaluating potential splits of geos. Creating a new design set involves 3 steps:
1. **Define your targeting**
2. **Set any Inclusion or Exclusion overrides**
3. **Define your date range**
 ### Define Targeting
Targeting allows you to define the set of geos potentially eligible to be included in your experiment. By default it pulls the unique set of geo types from your metric source from the last 90 days. You can add additional custom filters that help you filter your geos down, based on columns in your metric source. For example, you can filter geos to those in a certain region or by transactions that occurred in a certain language.
### Define Targeting
Targeting allows you to define the set of geos potentially eligible to be included in your experiment. By default it pulls the unique set of geo types from your metric source from the last 90 days. You can add additional custom filters that help you filter your geos down, based on columns in your metric source. For example, you can filter geos to those in a certain region or by transactions that occurred in a certain language.
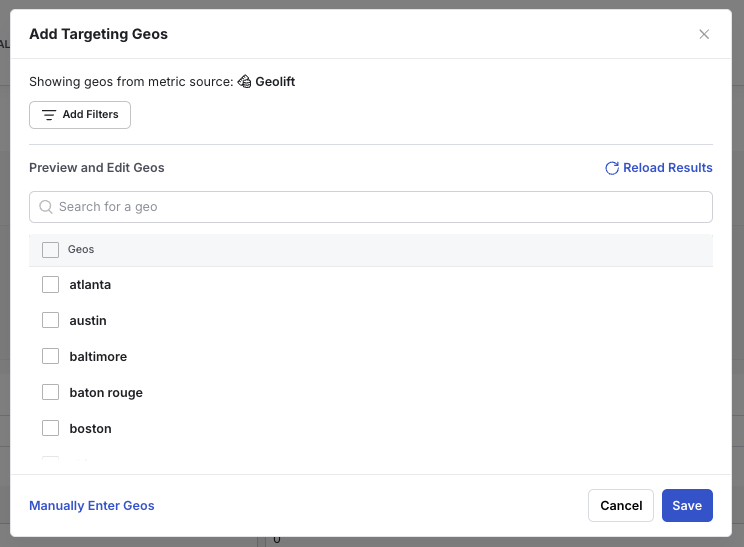 You can also manually specify a set of geos yourself. The geo id types must match those in your metric source exactly.
### Set Inclusion or Exclusion Overrides
After defining your targeting set, you can manually overwrite any of these geos into treatment or control groups as desired.
You can also manually specify a set of geos yourself. The geo id types must match those in your metric source exactly.
### Set Inclusion or Exclusion Overrides
After defining your targeting set, you can manually overwrite any of these geos into treatment or control groups as desired.
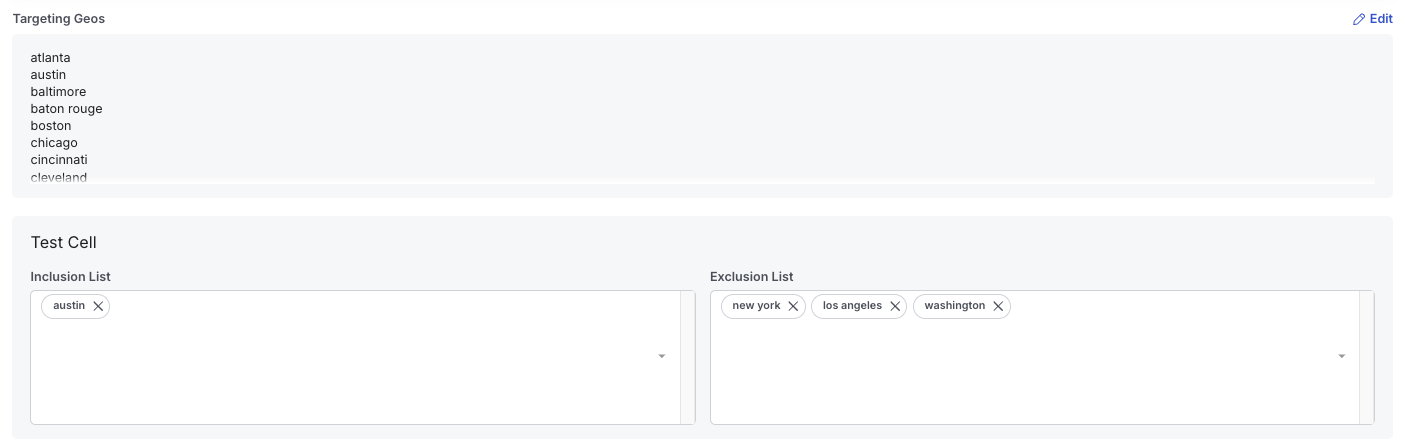 For example, when testing if a new marketing campaign is effective, you might know that you want include the city of Austin because a contract has already been signed. And you might know that you do not want to launch in New York, Los Angeles, or Washington D.C. because of local regulations. You can specify these constraints on the designer and it will ensure that all design options considered will conform to these rules.
### Define Date Range
Lastly, you must define the data range of your design dataset. This date range defines what data gets pulled as historical baseline to train a synthetic control model. In general, a good rule of thump is that you design data duration should be at least 4x the expected duration of your treatment period in order to achieve good fits and maximize sensitivity and power of your experiments.
### Advanced Options
* **Rolling Lookback Windows:** Control how many iterative simulations should be done to evaluate power. For instance, a value equal to 5 would simulate power for the last five possible tests in the date range. Corresponds to `lookback_window` in the GeoLift API.
* **Dynamic Time Warping:** Control how much the synthetic control model depends on auto-correlations in the metric vs. correlations between different geos on the same days. A value of 1 focuses exclusively on the metric while a value of 0 (default) relies on correlations only. Corresponds to `dtw` in the GeoLift API.
* **Control Cell Size Requirements:** Sets limits on the share of primary metric value from geos in any considered control group. If not set, all design options will be analyzed regardless of their size. For example, if designing on a Revenue metric, a control size range of \[50%, 90%] would mean that only design options where 50% to 90% of revenue was in the designated control geos. Corresponds to `holdout` in the GeoLift API.
## Evaluate Design Options
Once a Design Option Set has been created (usually takes a few minutes), it will be shown in your Experiment Designs tab. All design option sets generated are shown here, enabling you to look through prior design iterations as needed.
For example, when testing if a new marketing campaign is effective, you might know that you want include the city of Austin because a contract has already been signed. And you might know that you do not want to launch in New York, Los Angeles, or Washington D.C. because of local regulations. You can specify these constraints on the designer and it will ensure that all design options considered will conform to these rules.
### Define Date Range
Lastly, you must define the data range of your design dataset. This date range defines what data gets pulled as historical baseline to train a synthetic control model. In general, a good rule of thump is that you design data duration should be at least 4x the expected duration of your treatment period in order to achieve good fits and maximize sensitivity and power of your experiments.
### Advanced Options
* **Rolling Lookback Windows:** Control how many iterative simulations should be done to evaluate power. For instance, a value equal to 5 would simulate power for the last five possible tests in the date range. Corresponds to `lookback_window` in the GeoLift API.
* **Dynamic Time Warping:** Control how much the synthetic control model depends on auto-correlations in the metric vs. correlations between different geos on the same days. A value of 1 focuses exclusively on the metric while a value of 0 (default) relies on correlations only. Corresponds to `dtw` in the GeoLift API.
* **Control Cell Size Requirements:** Sets limits on the share of primary metric value from geos in any considered control group. If not set, all design options will be analyzed regardless of their size. For example, if designing on a Revenue metric, a control size range of \[50%, 90%] would mean that only design options where 50% to 90% of revenue was in the designated control geos. Corresponds to `holdout` in the GeoLift API.
## Evaluate Design Options
Once a Design Option Set has been created (usually takes a few minutes), it will be shown in your Experiment Designs tab. All design option sets generated are shown here, enabling you to look through prior design iterations as needed.
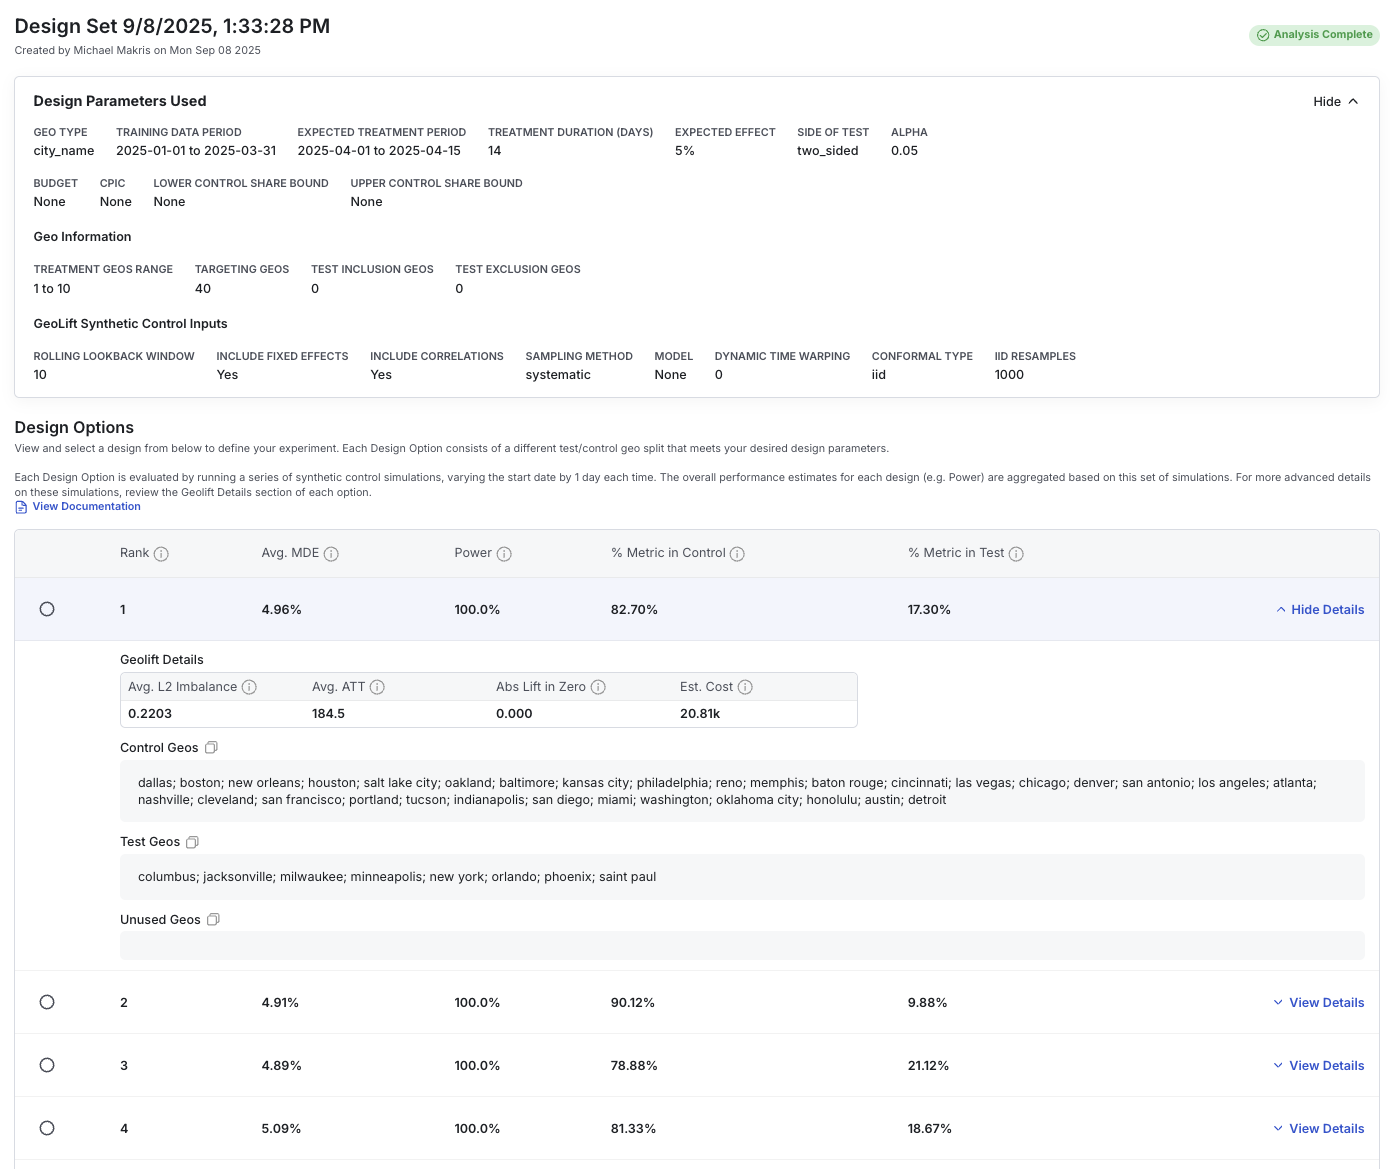
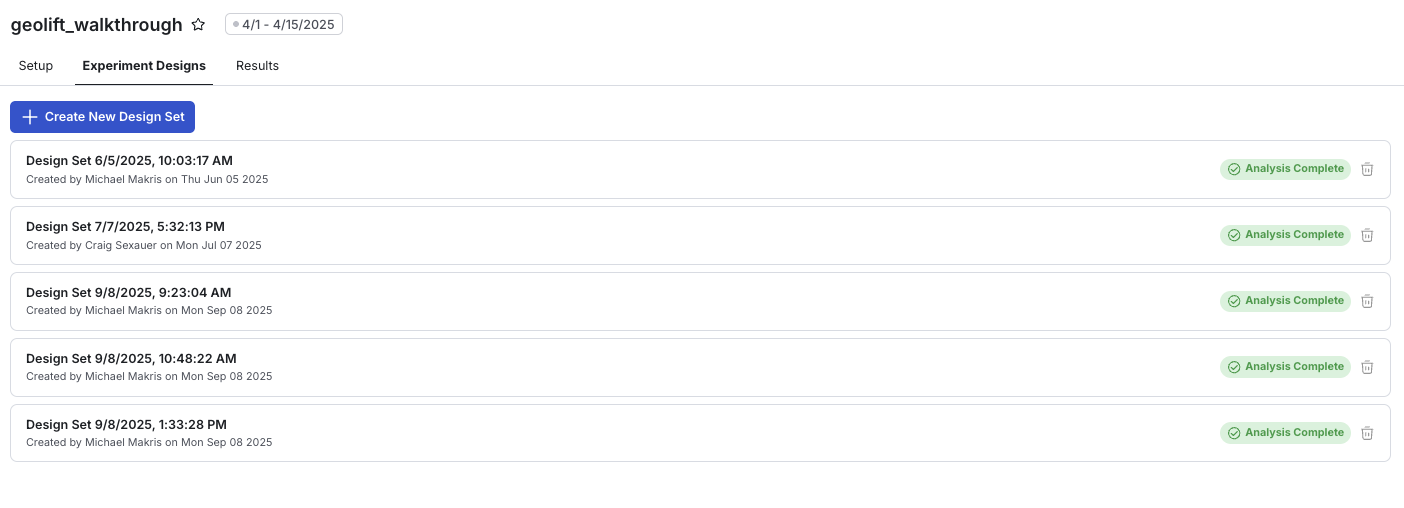 Click into a completed design set (e.g. “Design Set 3”).
* Review the ranked recommendations for your best design options
* Compare MDE, Power, Cost and Control/Test Allocation
* Click View Cell Details to expand and see specific geo assignments
* See additional model performance details
* Select your desired design using the radio button, and clicking **Save Design to Experiment**.
Click into a completed design set (e.g. “Design Set 3”).
* Review the ranked recommendations for your best design options
* Compare MDE, Power, Cost and Control/Test Allocation
* Click View Cell Details to expand and see specific geo assignments
* See additional model performance details
* Select your desired design using the radio button, and clicking **Save Design to Experiment**.
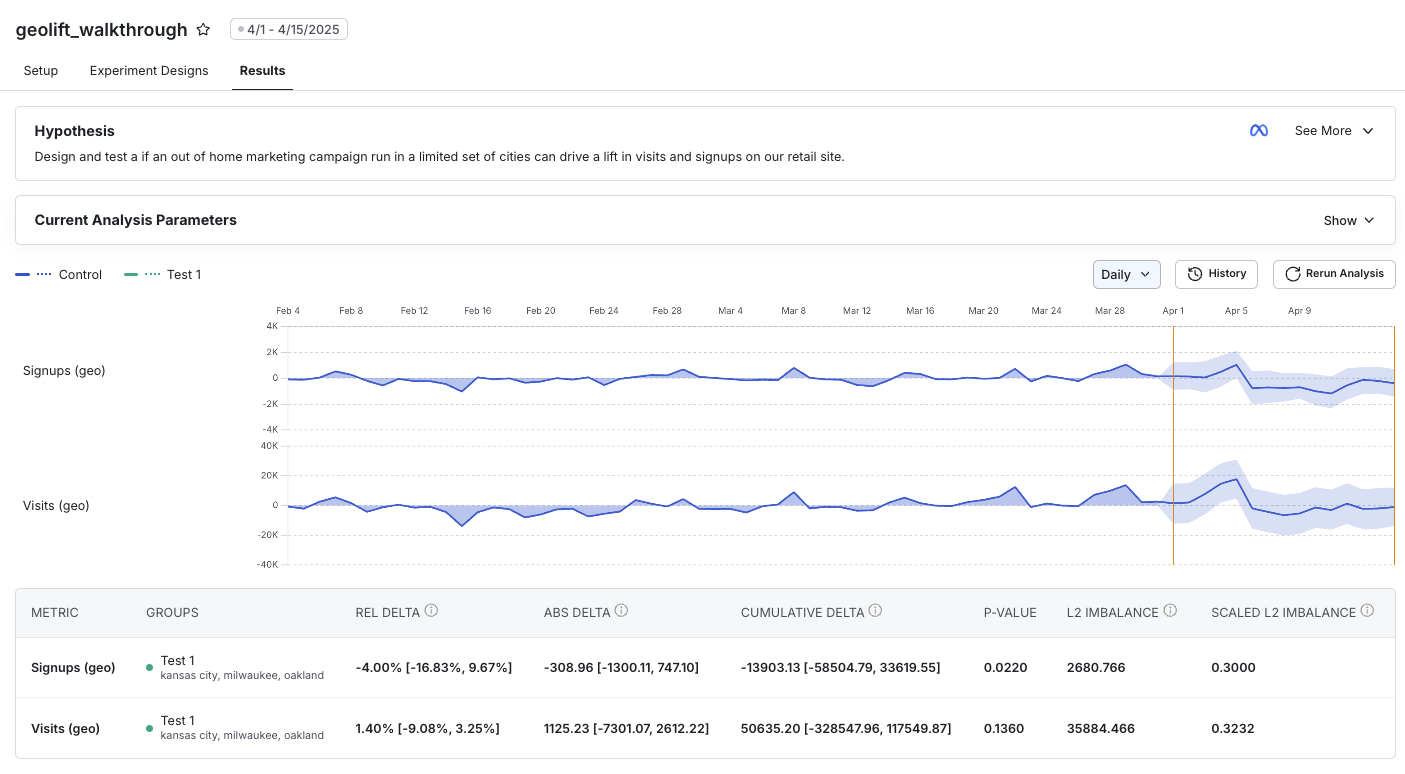
 ## Run Analysis